Maximize your social media ads with our analytics dashboard service
Our analytics dashboard service provides crucial insights for agents to track and optimize their social media advertising on Facebook and Instagram, helping them make informed decisions, improve their strategies, and achieve better results in driving engagement, generating leads, and increasing online visibility.
Data-driven decisions
Social media advertising metrics allow you to make informed decisions based on real-time data. You can optimize your strategies and allocate resources effectively to achieve better results.
Performance measurements
Track important indicators such as impressions, reach, click-through rates, and engagement rates to evaluate the effectiveness of your ads and identify areas for improvement.
Audience insights
Analyzing demographic data, interests, and behaviors of your audience all you to better understand their preferences and optimize your ads for better engagement and conversion.
What's included in our comprehensive analytics dashboard
Access comprehensive data, real-time monitoring, customizable reports, and actionable insights with our analytics dashboard to optimize marketing strategies and drive better results. Stay ahead with data-driven decisions.
Metrics we track
Amount spent
Refers to the total sum of money expended on advertising or marketing activities during a specific period.
CPM
Cost per mille or cost per 1,000. This refers to the amount you pay for every 1,000 impressions, or views of your advertisement.
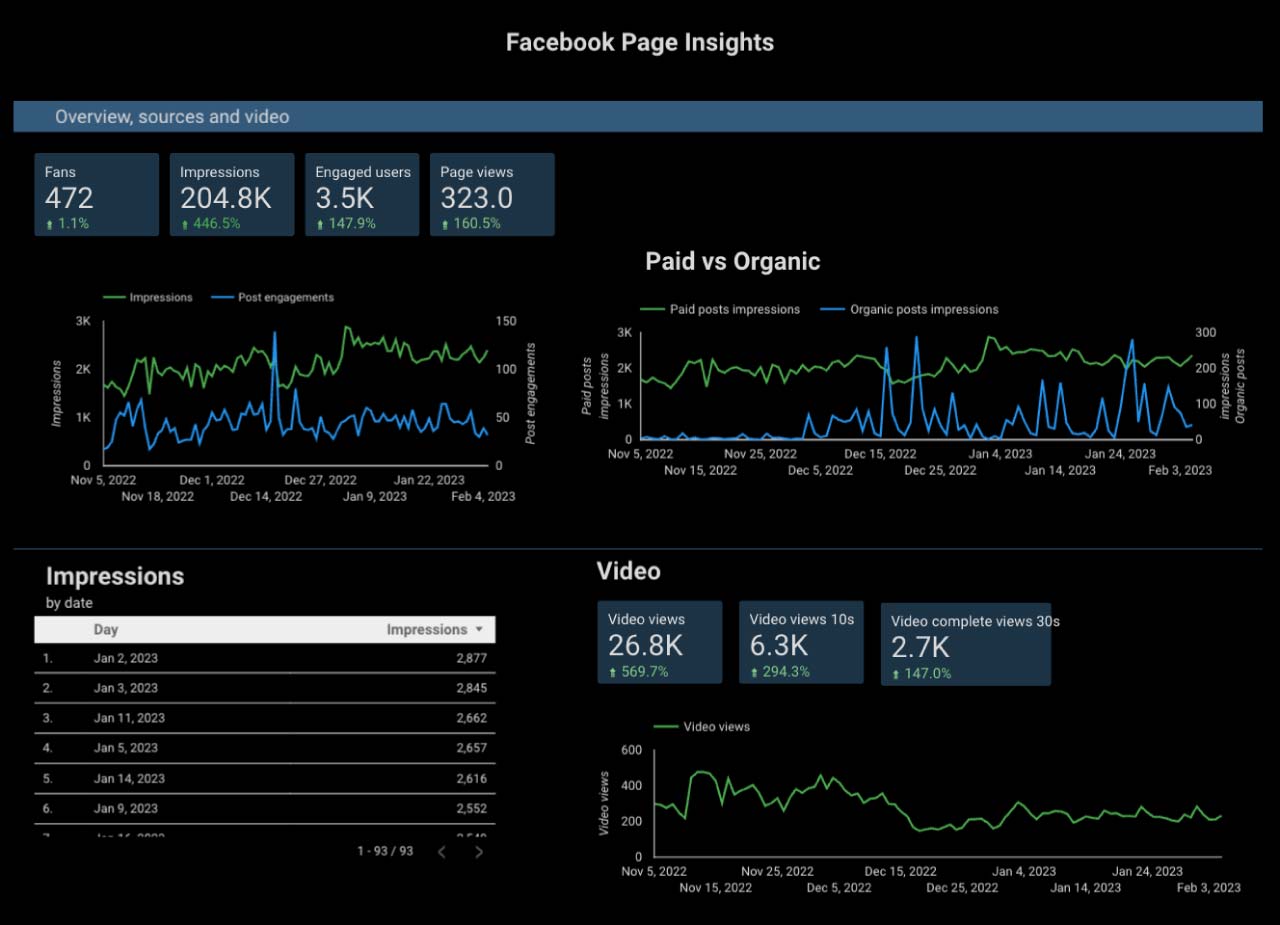
Impressions
The number of times an ad is displayed, measuring potential reach and ad exposure in a campaign or timeframe.
Link clicks
The number of times users click on a hyperlink in an ad or campaign, indicating engagement and interest in the content.
Click through rate
Measures ad effectiveness by tracking the percentage of users who click on it, indicating engagement and traffic generation.
Reach
The total number of unique users exposed to an ad or campaign, indicating the potential audience size reached without duplication.
Frequency
The average number of times an ad is shown to the same user, indicating the level of ad repetition within a campaign or timeframe.
Cost per click
The average amount paid by an advertiser for each click on their ad, influencing the overall campaign budget and performance.
Cost per post engagement
The average cost for an advertiser for each user engagement with a social media post, indicating campaign efficiency and effectiveness.
Fans
The number of users who have chosen to follow, like, or subscribe to a brand or account on social media, indicating their support and interest.
Engaged users
The number of individuals who actively interact with a brand's content, indicating a higher level of interest and involvement.
Video views
The number of times a video is watched by users, providing insights into its popularity and reach within a campaign or timeframe.